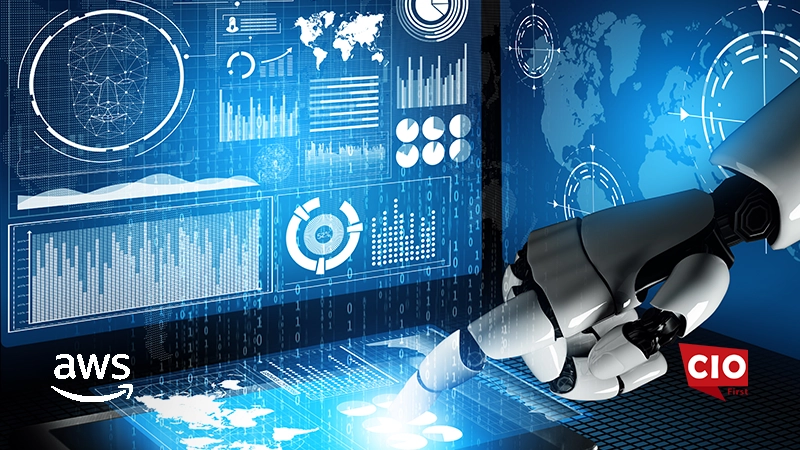
AWS has announced a new open-source tool, called the Prometheus MCP Server, which will provide AI-driven monitoring intelligence to Amazon Managed Service for Prometheus users. This addition enables AI-powered assistants, like those baked into coding tools and developer CLIs, to query infrastructure metrics using natural-language prompts rather than having to manually query metrics.
The Prometheus MCP Server is designed to simplify and accelerate core observability, performance monitoring, and incident‑response workflows by enabling AI code assistants to interact directly with a company’s Prometheus‑based monitoring infrastructure. This addition, according to AWS, reduces the learning curve around Prometheus Query Language, PromQL, making monitoring even easier for users without deep expertise in query syntax.
What This Means for the IT Industry
Lowering the Barrier to Observability and Monitoring
Accessing and analyzing infrastructure or application metrics have traditionally required familiarity with PromQL or manually navigating through dashboards-a barrier for many teams, especially smaller ones or those without dedicated SRE/DevOps staff. With Prometheus MCP Server, developers and operations teams can simply ask in plain English: for instance, “What’s the CPU usage over the last hour?” or “Show HTTP request rates and error percentages for service X.” The server then translates that request into PromQL, executes the query, and returns results.
This democratization of monitoring puts system health data, trend analysis, and performance issue troubleshooting in the hands of more team members-not just specialists. In turn, observability becomes more intertwined with everyday workflows rather than siloed in a dev‑ops niche.
Speed up incident response and improve reliability.
Because teams can rapidly query and analyze metrics through natural‑language prompts, they are able to respond to incidents more quickly. Rather than wait for an individual who knows PromQL or a dashboard to manually run queries, AI assistants interfacing directly with the MCP server can fetch current and historical data in seconds — everything from CPU and memory to errors and request latency. This could drastically cut MTTD and MTTR while improving reliability and uptime.
For businesses operating at scale-say, running complex cloud infrastructure or microservices-this equates to less downtime, fewer cascading failures, and better service quality.
Also Read: AWS Introduces “Spatial Data Management on AWS” – A New Era for Spatial Data at Scale
Scaling Monitoring Without Proportional Headcount Increase
As companies grow — adding more services, more regions, more workloads — the burden of monitoring scales too. Instead of increasing headcount to manage growing observability needs, enterprises can leverage the MCP server for scaling their monitoring capabilities with AI. Because the interface is through natural language and automated, organizations don’t need everyone to know PromQL or maintain complex dashboards. This reduces operational overhead while maintaining visibility across large-scale infrastructure.
Wider Business Impacts
Better Integration between Dev, Ops, and Business Teams: With the monitoring data accessible to nonspecialists, product managers, QA, and even business stakeholders can query performance metrics, therefore bridging technical and nontechnical teams, driving data-driven decisions.
This enables faster Time‑to‑Market for Cloud Apps. The developers can iterate, test, and deploy-and monitor-without waiting for specialized monitoring support, thus accelerating development cycles and reducing friction in releasing new features or services.
Cost Efficiency and Resource Optimization: As businesses make monitoring more efficient and available, they can quickly find overor underused resources. That will then enable better capacity planning, resource allocation, and may lead to possible cost savings on cloud infrastructure.
Improved Incident Management & Customer Experience: Faster, more accurate monitoring and troubleshooting reduce downtime and performance issues, leading to better user experience, retention, and operational resilience-critical for revenue‑driven services.
Challenges & Considerations
While Prometheus MCP Server has many benefits associated with it, there are considerations businesses must be aware of:
Data Governance and Access Control: Opening monitoring data to broader teams via natural‑language AI agents means making sure proper permissions are set and visibility boundaries. Organizations need to be very deliberate about who can query what.
Dependency on AI Tools – Not Total Replacement: Whereas AI-assisted monitoring is powerful, critical decisions and deep root‑cause analysis may still require human expertise and manual inspection. AI must enhance, not replace, human judgment.
Security and Risk Management: Since this is AI‑enabled automation, security risks do come in. Adequate care must be taken to secure credentials, audit access, and prevent misuse or data leaks.
Conclusion
With the launch of the Prometheus MCP Server, AWS is changing how companies monitor cloud infrastructure. By adding AI-driven, natural-language monitoring directly into observability systems, AWS is making it easier for everyone to access these tools. This will speed up infrastructure oversight and reduce the need for specialized IT skills. More teams can now monitor, analyze, and respond to system metrics effectively. For businesses, this means improved reliability, faster operations, better cost efficiency-and ultimately, stronger resilience and competitiveness in a cloud‑first, data‑driven world.


