For years, IT had an uncomfortable seat at the business table. It kept systems running, fixed tickets, managed infrastructure and defended its budget. That was enough when technology sat mostly behind the scenes. It is not enough anymore. Today’s boards want to know what technology is doing for growth, productivity, customers and resilience.
That is where the business value of IT metrics becomes important. These metrics connect technology activity with outcomes the wider business actually cares about. Revenue generated, time saved, costs reduced, customers retained and risks avoided all tell a better story than technical activity alone.
This article looks at how CIOs can make that shift, turning operational data into a clear picture of technology’s contribution to enterprise growth.
The Evolution of IT Metrics and Bridging the Gap with the Board
Traditional IT reporting was built around operational health. Ticket volumes showed workload. Mean time to resolution showed service efficiency. Uptime showed reliability. Those numbers still matter. The problem starts when they become the final answer.
A CFO does not necessarily care that the IT team closed 4,000 tickets. The better question is what those tickets meant for the business. Did faster resolution protect employee productivity? Did better uptime prevent lost sales? Did automation remove repetitive work from hundreds of employees?
This is the shift behind the business value of IT metrics. CIOs need to move from reporting what IT does to explaining what IT changes.
The timing makes this even more important. The World Economic Forum reported that more than $250 billion was invested in AI globally in 2025, yet only 25% of companies said AI was having a transformative impact. The problem is not simply a lack of technology. Many organizations are adding AI to old processes instead of redesigning how work gets done.
That points to a layered approach. Operational KPIs should sit at the bottom. Technology outcomes should sit above them. Business outcomes should sit at the top. When those layers connect, a metric such as uptime stops being a technical score and becomes evidence of revenue protection, customer experience or operational continuity.
Measuring Technology’s Impact on Revenue and Growth
CIOs are increasingly expected to become revenue enablers rather than budget defenders. That does not mean IT should suddenly own sales. It means technology leaders need to show how their investments create conditions for growth.
Digital channels provide a simple example. If a company launches a new mobile platform, online marketplace or digital payment experience, the IT team can measure availability and deployment speed. However, the business value appears somewhere else. It shows up in transactions, new customers, conversion and revenue.
That makes IT-enabled revenue growth an important metric. CIOs can track revenue generated through technology-enabled channels and compare it with the investment required to build and operate them. Time-to-market matters too. A digital product that reaches customers three months earlier can create value that a delayed launch cannot recover easily.
Also Read: How to Manage Shadow IT in a Hybrid Work Environment: A CIO’s Guide to Reducing Security Risks
Technology ROI should also move beyond project completion. A transformation initiative should not be considered successful simply because it went live on time and within budget. CIOs should ask whether it increased revenue, reduced friction, improved capacity or opened a new market.
IBM’s 2026 CEO research offers an interesting signal here. Organizations with tailored AI visions expect 13% more of their 2030 revenue to come from products and services that do not exist today. The implication is bigger than AI. Technology can create value by helping businesses build things they could not economically deliver before.
That is the real role of business value of IT metrics in growth. They connect technology investment with the commercial opportunities created by that investment.
Driving Productivity and Cost Efficiency
Cost efficiency is often where IT reporting becomes too narrow. Leaders look at whether the technology budget went up or down. That tells only half the story.
A better approach measures what the business receives in return.
Consider automation. If an IT workflow removes repetitive work, the relevant number is not simply how many automated processes were deployed. It is how many productive hours the business recovered. Those hours can then be redirected toward customer work, product development, analysis or other activities that create value.
This makes productive hours recovered a useful IT productivity metric. The same logic applies to AI. If employees use an AI tool but spend almost as much time checking its output, the headline productivity gain may be misleading. CIOs need to measure the complete workflow rather than celebrate tool adoption.
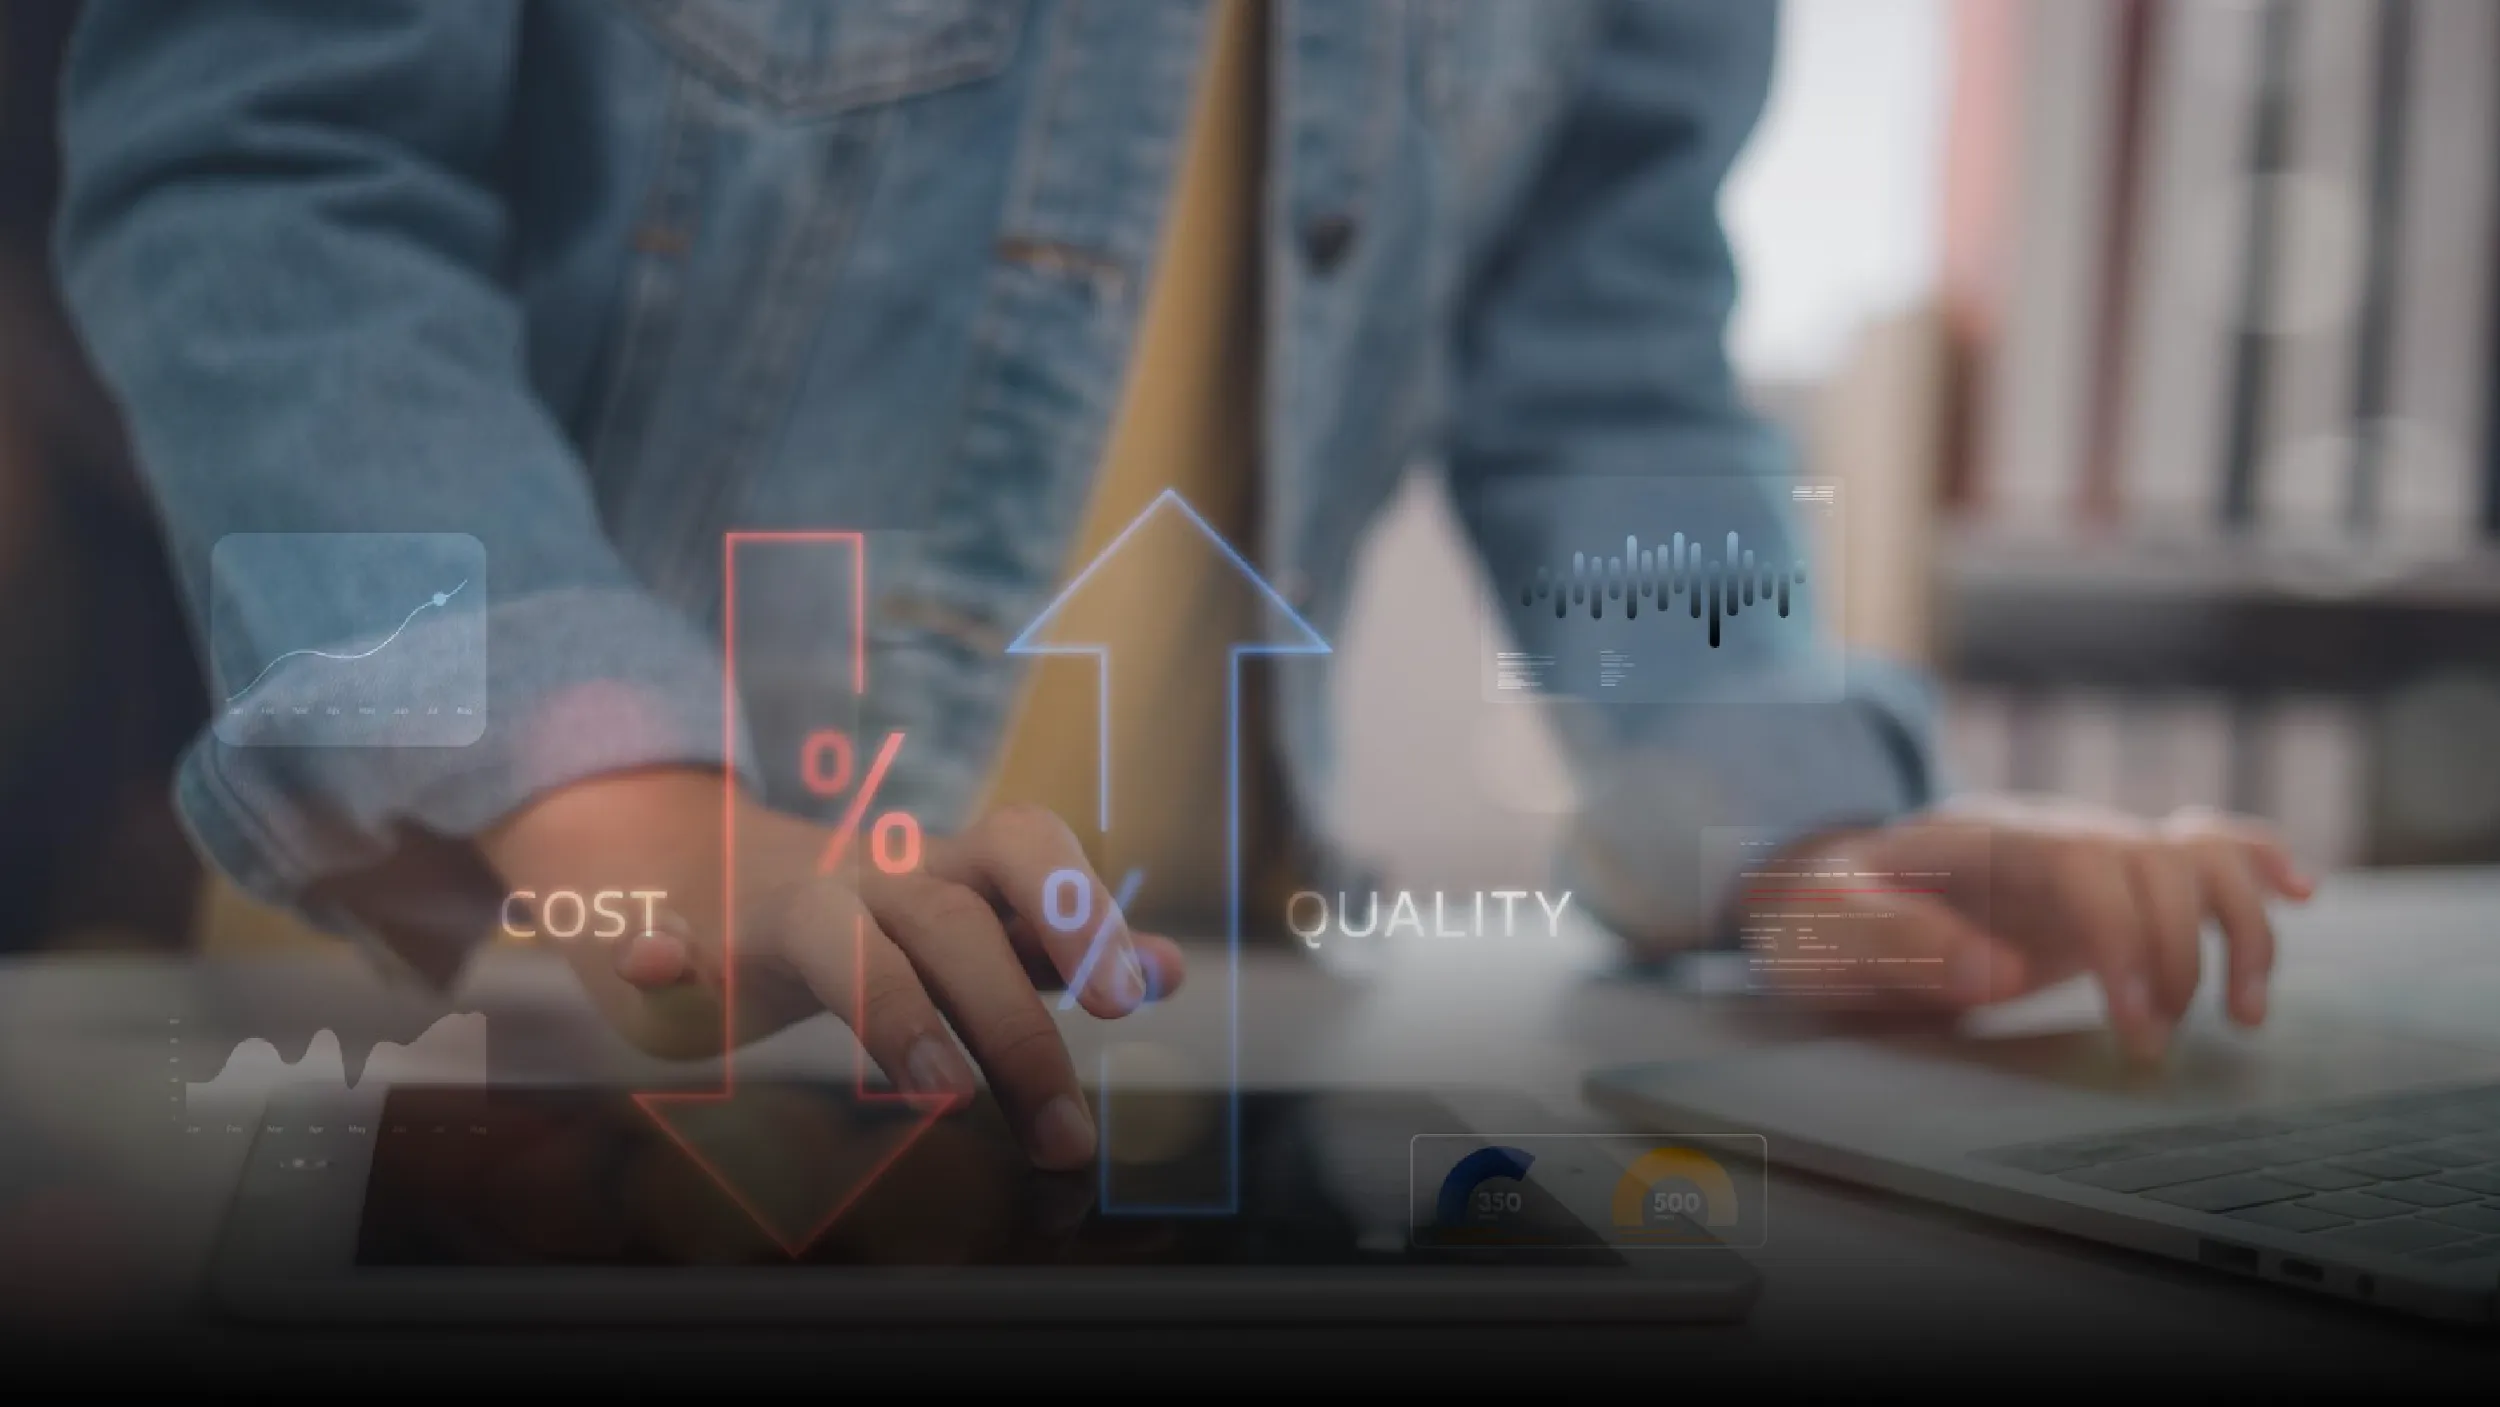
Technology spend should also be compared with business value created. A useful technology value-to-cost ratio can bring together investment, savings, additional revenue and measurable productivity gains. Meanwhile, cost per transaction can reveal whether infrastructure is becoming more efficient as digital activity grows.
The broader economic picture supports this shift. The OECD’s 2026 productivity research found that ICT investment rates increased in 27 of 35 countries with comparable data. ICT assets also saw higher investment rates in more than three-quarters of OECD countries compared with the 2010–19 period.
The message for CIOs is straightforward. Technology is increasingly part of the productive capacity of a business. Therefore, business value of IT metrics should measure not just what technology costs, but what that investment enables the organization to produce.
Elevating Customer Experience Through Technology
Customers rarely care which database; cloud platform or application architecture sits behind a digital service. They care whether the service works.
That makes customer experience one of the clearest ways to show the business value of IT metrics. A technical failure can quickly become a commercial problem. An unavailable application can stop purchases. Slow pages can create friction. A poor service workflow can push customers toward competitors.
CIOs should therefore connect customer-facing application availability with actual business impact. Instead of reporting downtime only in minutes, they can estimate the transactions or revenue placed at risk during those periods.
Latency deserves similar treatment. The useful metric is not simply response time. It is the relationship between response time and customer behavior. If slower digital experiences consistently coincide with lower conversion, technology leaders have a business case for improving performance.
Customer satisfaction provides another bridge. Salesforce’s 2026 customer-service research found that AI-service-agent adoption rose 1.7 times, from 39% to 66%. Among organizations using these agents, 70% reported measurable value within 60 days, with customer satisfaction ranking as the leading improved KPI.
That matters because efficiency alone is not the destination. Faster service has value when it improves the experience customers actually receive. Business value of IT metrics becomes more meaningful when technology performance can be connected to satisfaction, retention and customer behavior.
Quantifying Enterprise Resilience and Risk Mitigation
Some of IT’s most important contributions are invisible when everything works.
A successful recovery from a major outage does not create a headline. Preventing a security incident rarely appears as revenue on a financial statement. Yet both can protect significant enterprise value.
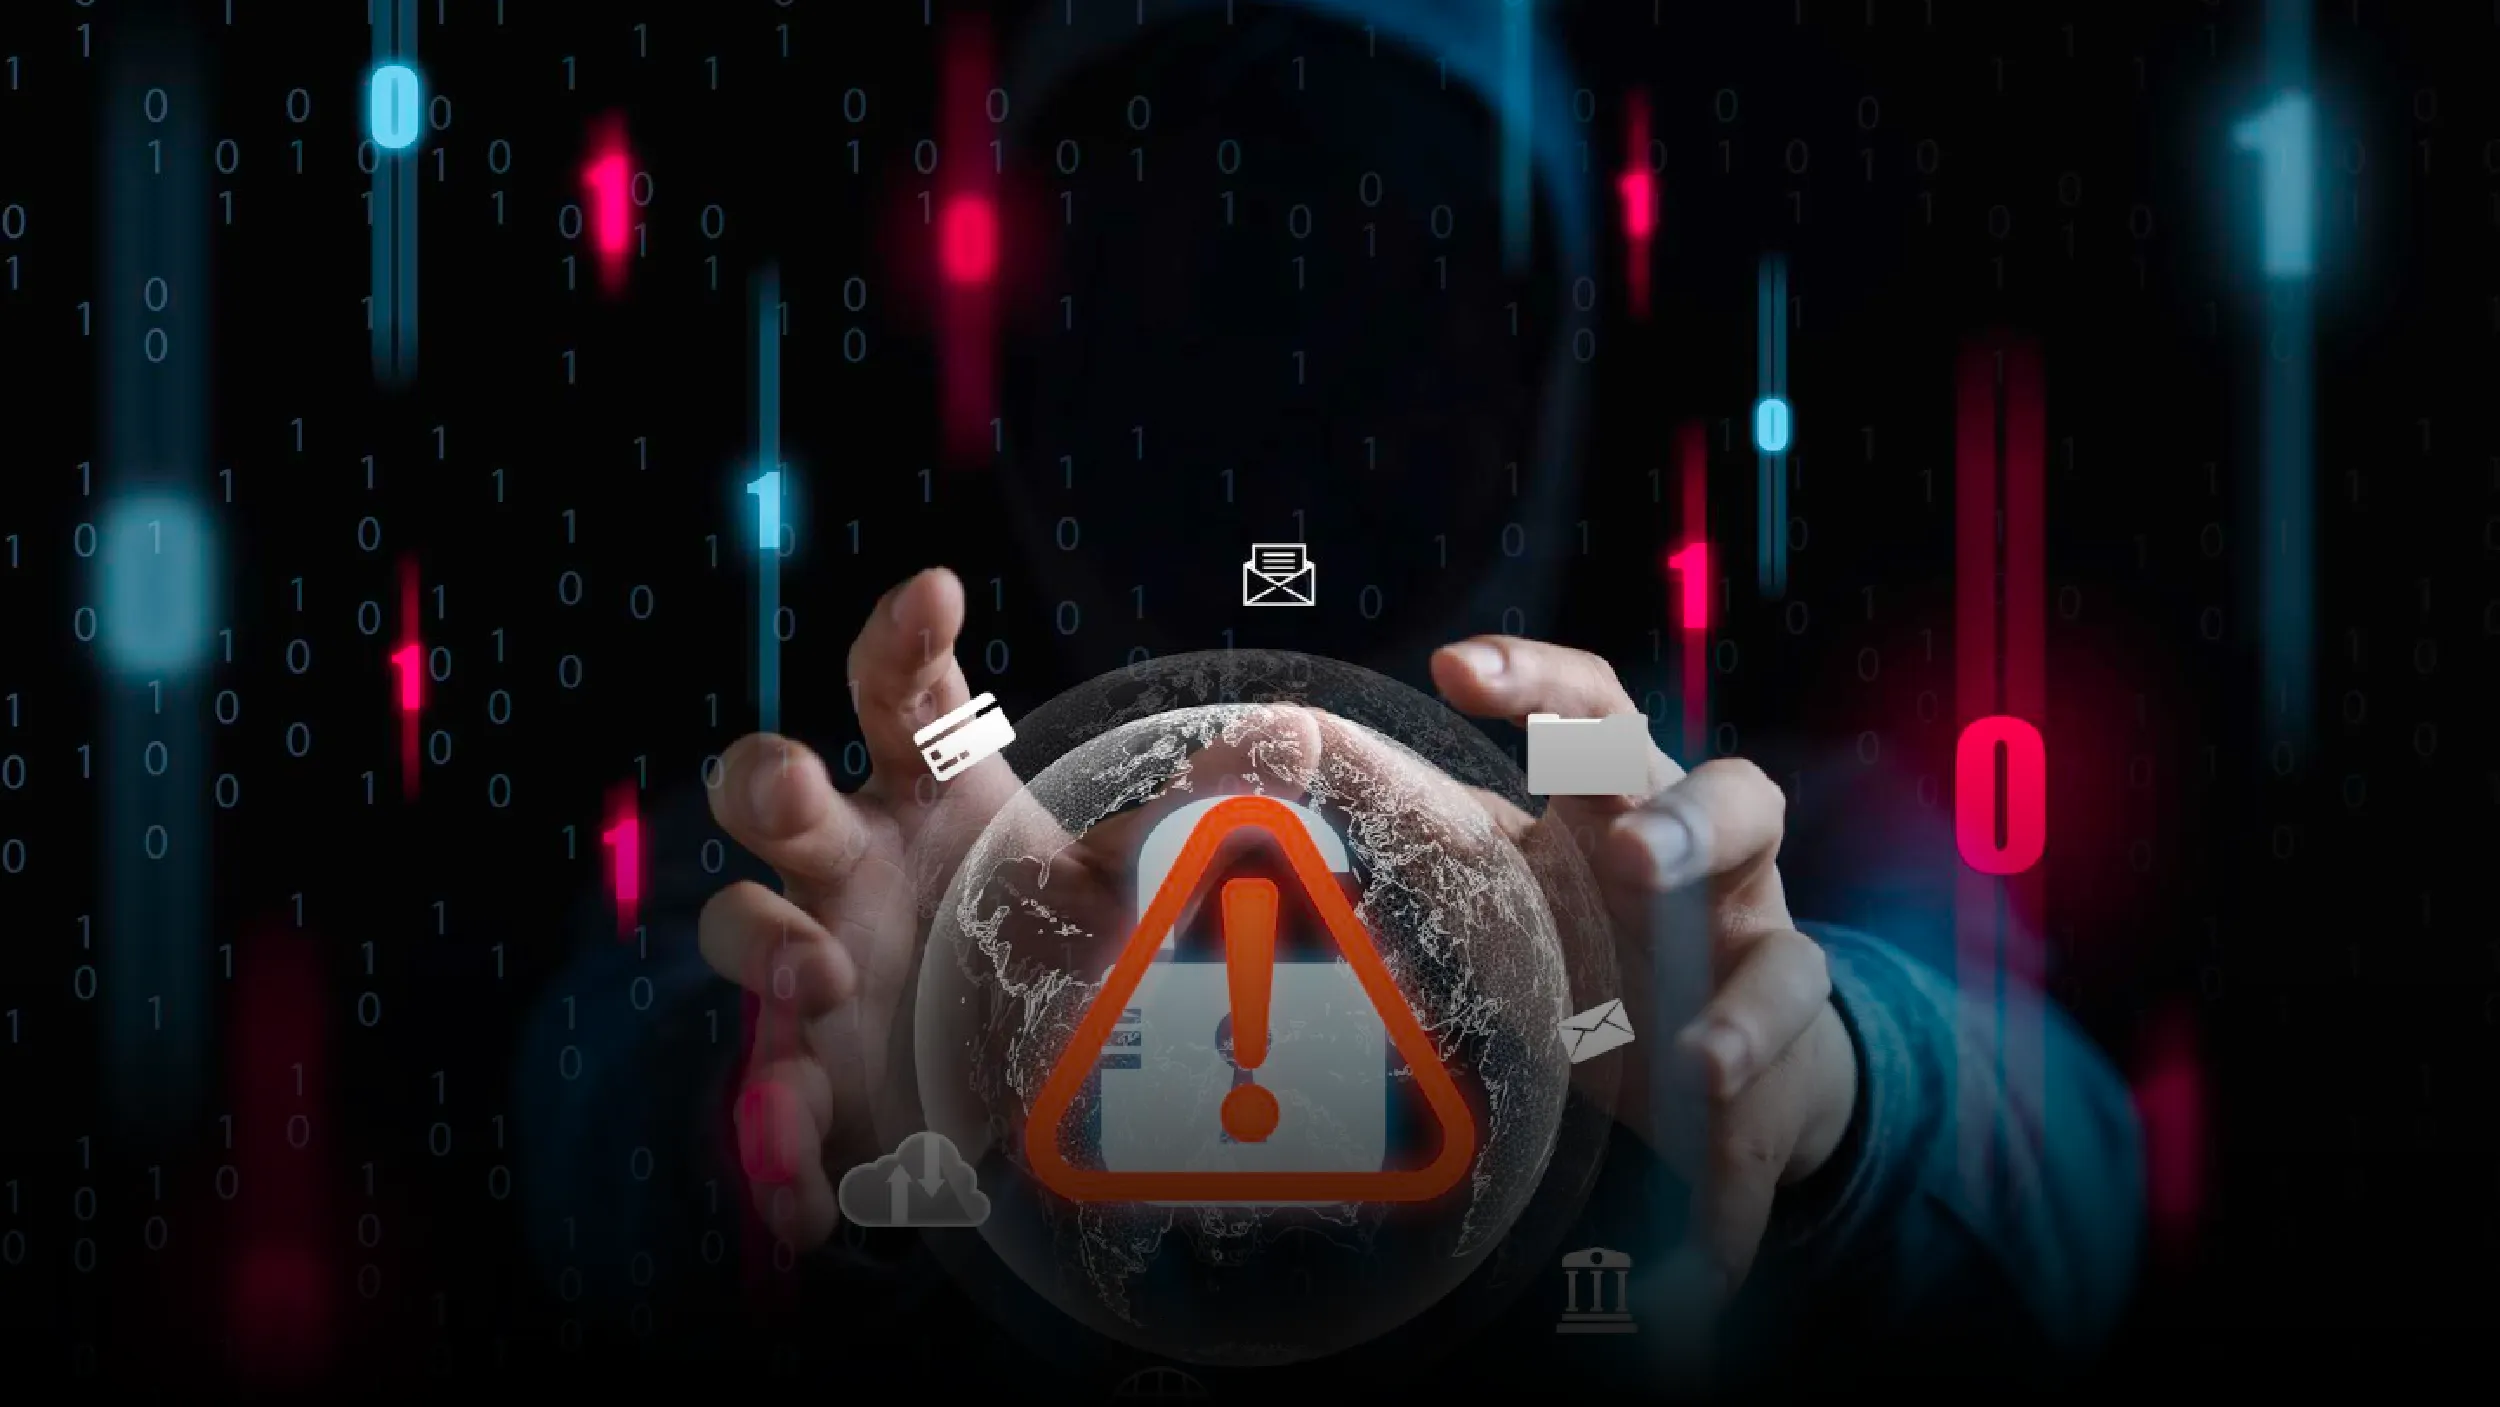
This is why resilience metrics need a business translation. CIOs can estimate the cost avoided through prevented incidents and connect Recovery Time Objective and Recovery Point Objective to the amount of revenue or operational capacity protected during disruption.
Patch compliance offers another example. Reporting that 98% of systems are patched may demonstrate discipline, but it does not explain why the number matters. The stronger conversation connects patching with reduced exposure and lower business risk.
NIST’s AI Risk Management Framework reinforces this approach. Its Measure function calls for organizations to use quantitative, qualitative or mixed methods to analyze, assess, benchmark and monitor risks and their impacts. It also emphasizes performance assessment, uncertainty, benchmarks and formal reporting.
The lesson is simple. Risk measurement should not stop at technical activity. Business value of IT metrics should help leaders understand what risk the organization has reduced, what disruption it can withstand and how much enterprise value it is protecting.
Building the CIO’s Executive Dashboard with the Right Metrics
A board dashboard should not become another IT data dump. Six to eight KPIs are enough if each one answers a business question.
The strongest dashboard can connect revenue, productivity, customer experience and resilience in one view. IT-enabled revenue can show growth contribution. Productive hours recovered can show workforce impact. Cost per transaction can show efficiency. Customer satisfaction can show experience. Revenue protected can show resilience.
The definitions matter just as much as the numbers. CIOs should build them with finance and business-unit leaders instead of creating metrics inside IT and presenting them as finished products.
Most importantly, every KPI should have a clear line back to a current business priority. That is what turns business value of IT metrics from a reporting exercise into an executive decision tool.
Conclusion
The uncomfortable truth is that technology can be extremely busy without creating much business value. More deployments, more tickets closed and better infrastructure utilization do not automatically mean the company is growing faster or serving customers better.
CIOs need to challenge that old reporting habit. The strongest business value of IT metrics connects technical performance with something the enterprise can recognize as valuable. Revenue created. Time recovered. Costs avoided. Customers retained. Risk reduced.
The next board presentation should therefore start with business questions, not technology activity. Which investments are creating growth? Which are improving productivity? Which are protecting customers and enterprise value?
That is where IT reporting stops being a scorecard and starts becoming a business conversation.